
Simple web analytics with GoAccess
Simple analytics for a simple site.

Running your own website isn't necessarily a hard thing, but it is time consuming. Over the years I have used three different hosting services, two different webservers and three web applications; of which the current one is Ghost.
Before I had migrated to Ghost, I was running ForkCMS along with an analytics tool called Piwik (now known as Matomo). It was a simple setup, however the injected Javascript and tracking pixel was obtrusive and easy for users to block on their browsers.
At the same time, I was storing a beautiful Nginx log with useful information about hosts, user-agents and request URIs. So I wanted to see what tools were available to analyse this data. A quick google search for "access log analytics", lead me to GoAccess.
I won't spend too much time on the setup instructions, as they are done very well on their install page.
However after installing on Ubuntu with Nginx, I would recommend the following things, that I have done after a few weeks with it.
- Log rotation; check
logrotateis enabled to run daily through/etc/cron.daily/logrotate. This means GoAccess can crunch smaller access log files. Nginx should also have a default logrotation config in/etc/logrotate.d/nginx. - Alias; creating a bash alias in
.bashrcis useful if you want to login to your remote server and quickly see some stats on the terminal by typinggo-access-terminal
alias goaccess-terminal='goaccess /var/log/nginx/access.log --log-format=COMBINED'- Cron; its nice to get weekly snapshots with GoAccess, so I created an entry like the following in
/etc/cron.weekly/goaccess
goaccess /var/log/nginx/access.log -o /var/log/goaccess/"report-`date '+%Y-%m-%d'`.html" --log-format=COMBINED >/dev/null 2>&1This dumps a nice date stamped HTML report into this folder on a weekly basis (note, the /var/log/goaccess folder had to be created beforehand).
This directory can then be easily zipped up and later analysed. I am also currently trying to sync it with another server which will then deliver it privately over Nextcloud.
You could also expose the reports through a directory in your web server, however even though the information isn't too detailed, I would prefer it not to be public.
Benefits of GoAccess
- No reliance on cookies or javascript trackers; unlike Google Analytics or Matomo which can't give you the full picture when a client blocks them, GoAccess gives a 100% summary of every single client that has made a request with your web server.
- Built in config standards for Nginx, Apache and others. This makes it fairly easy to extract information immediately without much configuration. In fact a user doesn't even need to have access to the web server itself, they only need to be able to read the log file.
- No stack required to use it, its a self contained C++ application with one GNU application dependency (ncurses).
- Run it through terminal or generate HTML/JSON/XML reports when needed, it is not always running and consuming resources in the background.
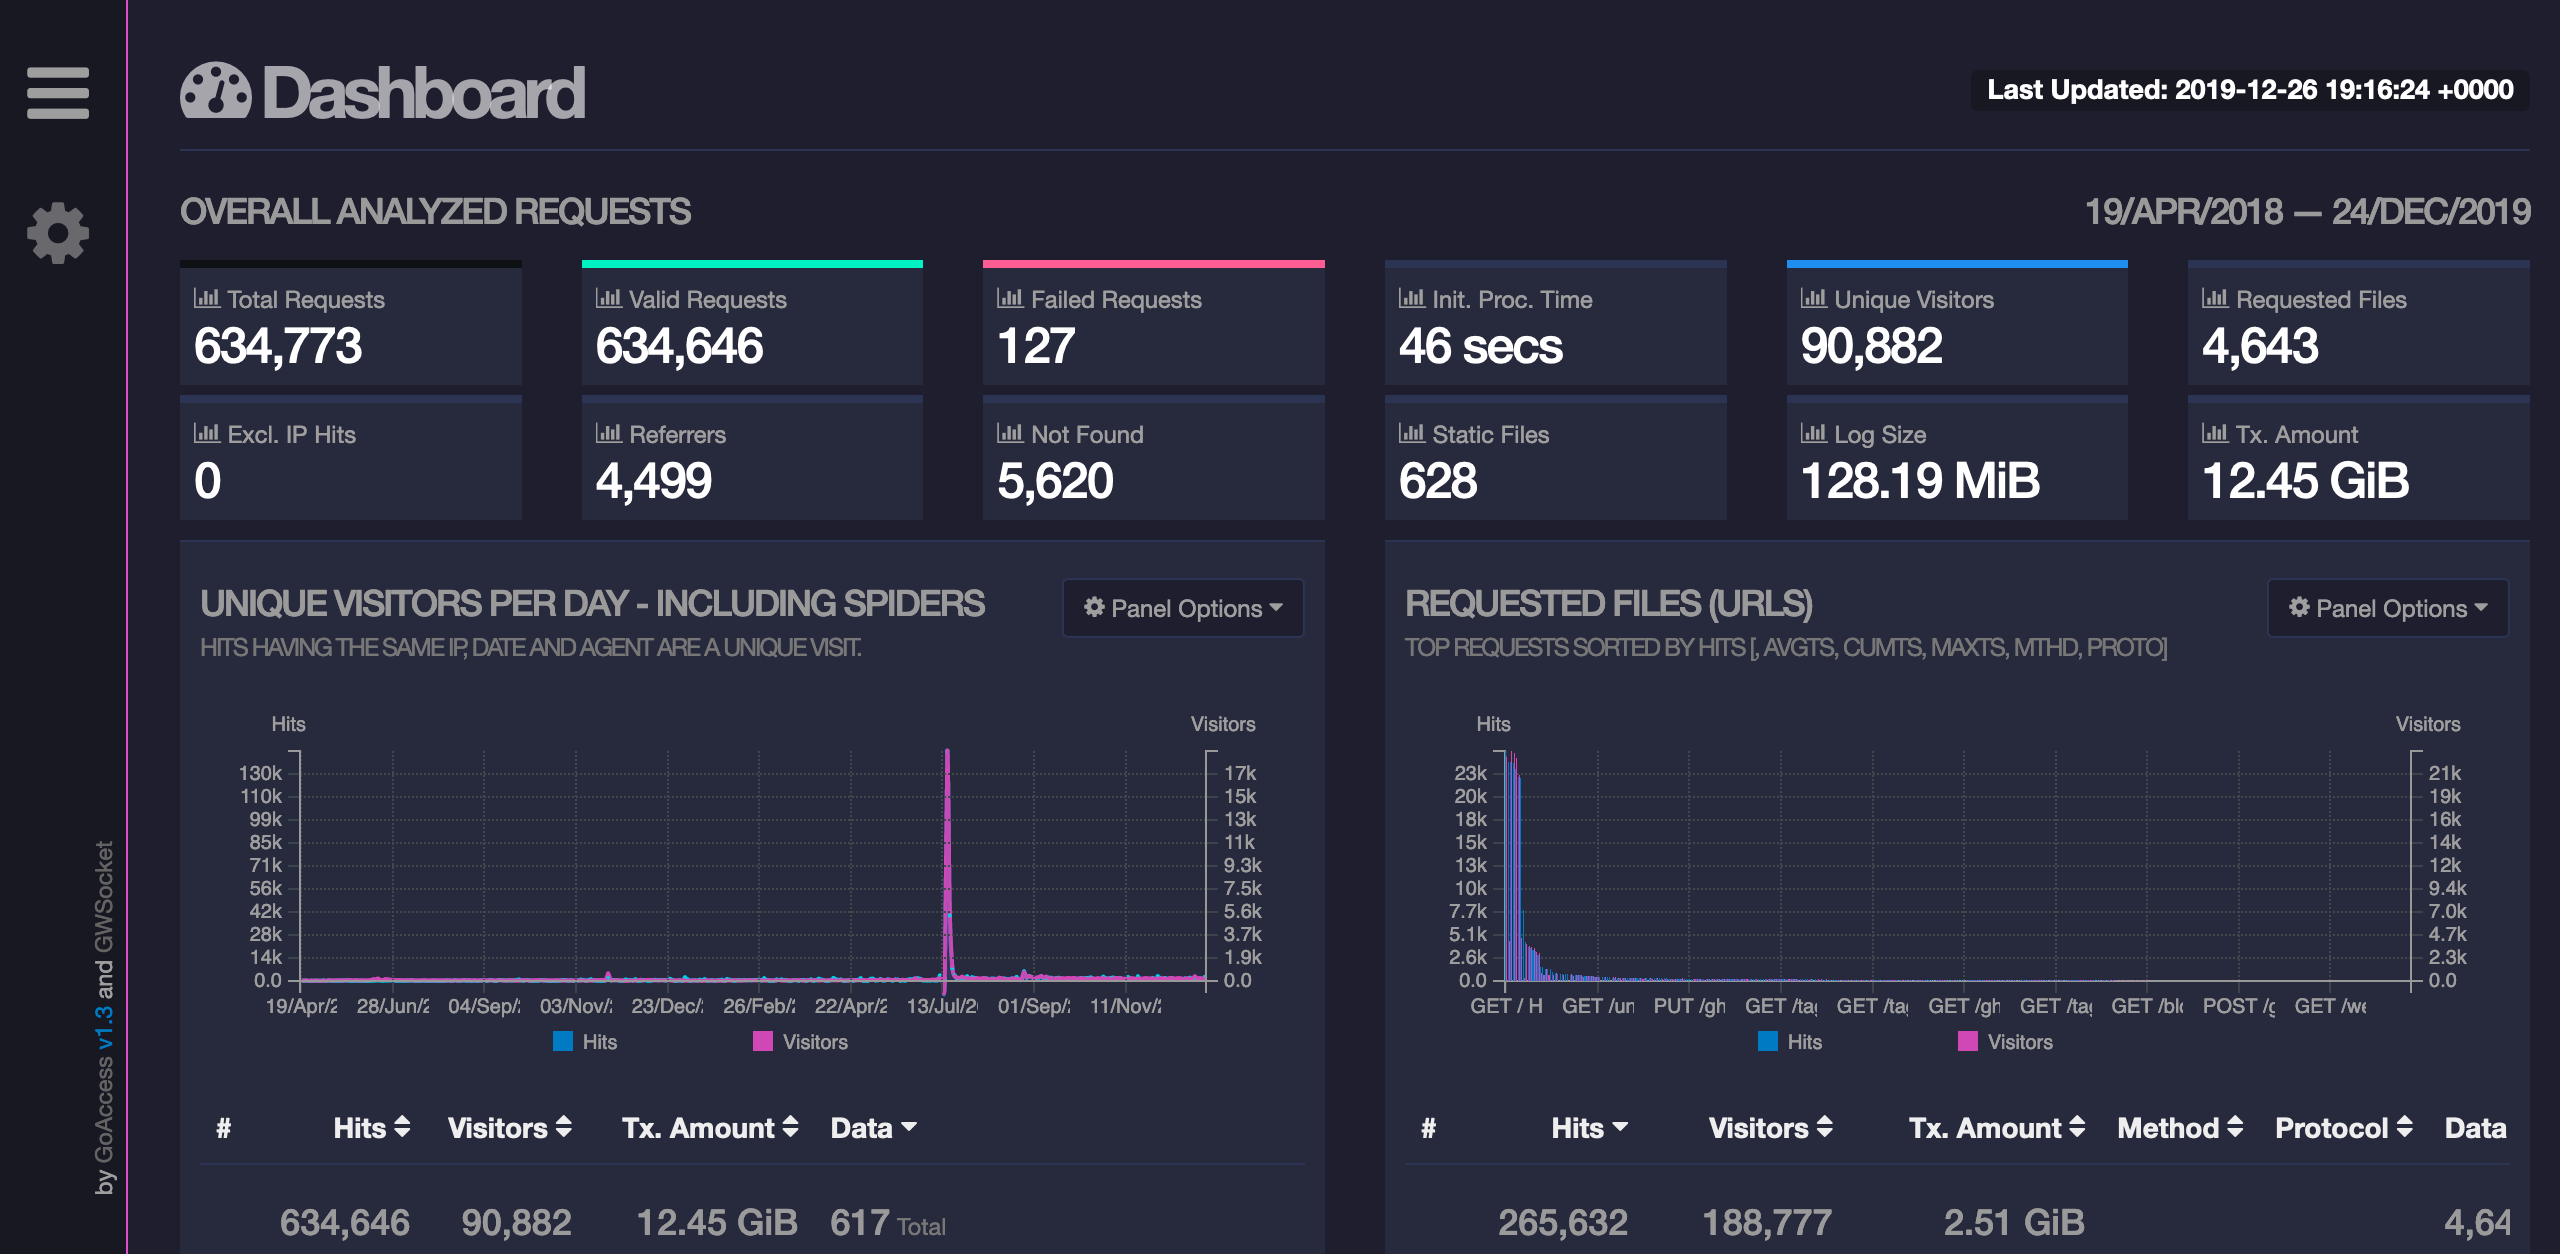
- HTML reports are very interactive and you can manipulate the graphs and interrogate the data.
- The console, gives sys-admins flexibility to see what's going on without the need for exporting a report.
- Simplicity, about 5 minutes to install and then 10 minutes to implement it into a solution.
Summary
This is a simple analytics tool which is fine for a small business or a personal site. However it does not have all the bells and whistles of Google Analytics or Matomo.
It would be nice if some of the big CMS and web apps can develop plugins to consume GoAccess data, this should allow more adoption.
The fact that it can crunch any access log file would make it an interesting choice for analysing mounted log files from a kubernetes instance.
Note: I have not used the live analytics version using websockets and the largest log file I tested with was approx 90mb, so YMMV on a production environment.